Considering Global Expansion
When companies want to expand overseas, they usually look into learning the best practices for expansion, guaranteeing them to know any constraints, regulations, and documentation needed to enter their target country.
It is imperative to navigate this process the right way to maximize the chance of success.
However, it still might be a little vague for certain companies, especially if expanding overseas is the right strategy for them.
In this case, it is important to have access to use cases showcasing tangible numbers, projecting how much companies can make if they decide to take the plunge.
Planning and Research When Entering New Markets
It is not to be ignored that the cost of living depends on where you are implemented, which can simultaneously impact your earnings. Knowing how much you can earn helps you clearly visualize the opportunity cost of taking your chances overseas.
For instance, the difference between the cost of living in India and the United States is pretty high; according to Expatistan the cost of living in the United States is 197% more expensive than in India.
In this article, we will compare how much your company can earn staying local versus expanding in the US.
Return on Investment (ROI) Calculations
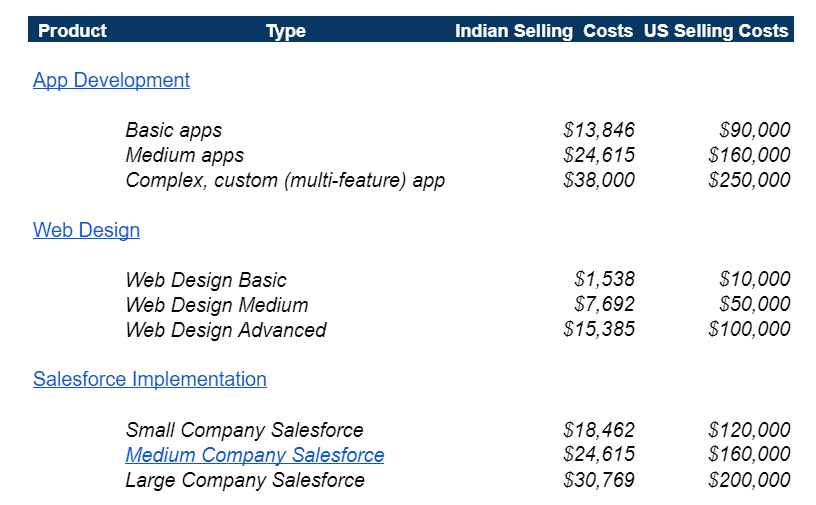
Based on our independent analysis, we found that India’s average selling cost was lower than the US one by a ratio of 6.5 to 1. We will present to you below how much prices can fluctuate depending on the product and how different your revenue growth can be if you let us help you expand to the US.
We guarantee a 52% Yearly Customer increase if you expand your business with us compared to a standard 17% increase and a 23% increase in Revenue Growth compared to 8% if you stay in India.
You can make more revenue in the US as an Indian Tech company than if you stay in India.
Expanding into the US and deploying your product can enable you to scale your revenue by 6.5 over the next five years.
Here is a case example:
To illustrate, let’s start with India’s potential revenue for a complex and customized app with multiple features.
India vs US Expansion – 5 years Revenue Projection – Complex & Customized App Implementation
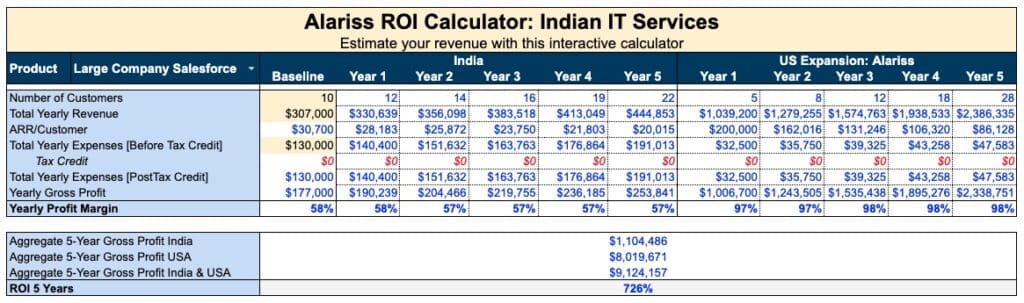
Looking at table, at first sight, we can see that the Total Yearly Expenses have higher numbers in India compared to the US for the selling cost of a customized app. We can see for India in Year 1 Yearly Expenses of $140,400 increasing each year incrementally until attaining $191,013 in Year 5 representing an increase of 36%.
Comparing these projecting figures to those of the US expansion, first, we can see a clear difference and lower numbers for the Yearly Expenses, from $32,500 in Year 1 to 47,583 in Year 5; however, it results in a 46% increase which makes the US more expensive in this regards with a 28% difference compared to India.
However, this larger number can be explained because of the higher cost of living for the US, so indeed you will end up having more expenses but more profit too in the medium and long run.
Now, let’s look into another use case; we will look at the difference between the Indian selling price versus the US selling price for a Salesforce implementation.
The projected aggregate gross profit for the US after five years is estimated to be $8,019,671 compared to $1,104,486 for India for a Salesforce implementation. This represents a 626% increase between the two numbers.
We can observe a clear difference in the Yearly Profit Margin between both countries. As we see in table {3} and {4} In India, the Year 1 Profit Margin is 58% and then decreases by 1% and remains at 57% until Year 5.
Then, compare the data with the US: we can see that 97% of Profit Margin for Salesforce is generated in Year 1 and 2 and that it increases to 98% in Year 3, remaining the same until Year 5.
Despite a slight decrease in the difference in table {3}, it still shows a higher growth pattern for the US than India.
The gap between both countries’ Yearly Profit Margins at Year 5 is 72%. The above information shows the clear gap for revenue growth and that the US is more profitable in a shorter period.
Overall, we were able to see that you might be able to profit in India but if the need is to scale your business rapidly, expanding in the US is more advantageous.
Now, you can quickly and efficiently make the first move towards a more profitable, global business and higher visibility. You will be able to allocate remaining resources to your marketing department to target new customer segments and tailor their marketing strategies or sales department to create more effective lead generation strategies to positively impact your productivity, so that you can focus resources in the highest-leverage markets, like the US.
Next Steps in Your Global Expansion Journey
In this article, you can see the difference between potential revenue in India vs the US.
The US is a highly profitable market where the potential revenue for your business can be higher. It is a place where many international companies decide to expand their business and grow.
We recognize that it can be hard to expand to another country due to a lack of information and uncertainties. We hope this article can be an asset for you to see what can entail from your potential US expansion and that it provided additional incentive to expand your business to the US and grow your reach and notoriety.
If you want to know more about expanding your business overseas, Alariss can help you set up your US operations. We have helped Indian companies set up their US entities and operations so they could generate 6x revenue, so if you would like to chat with our team about US expansion, click here to schedule an appointment today.